

Bitcoin (BTC) has been consolidating for over two months, with technical indicators suggesting the cryptocurrency may soon test key resistance levels, potentially paving the way for a breakout.
Notably, an analysis by TradingShot highlights that BTC has been consolidating within a ‘Rectangle’ pattern, displaying remarkable technical symmetry, which could help trace its next move.
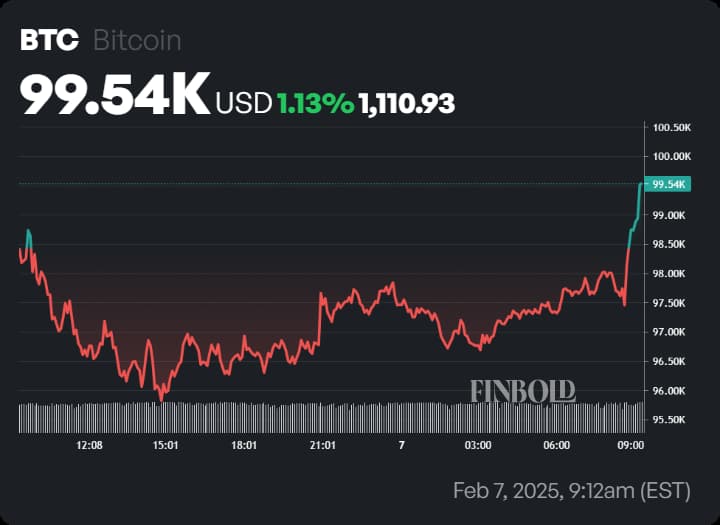
Bitcoin one-day price chart. Source: Finbold
At press time, BTC is trading at $99,543, with a one-day gain of 1.13%. Despite its year-to-date gain of 3%, Bitcoin’s price has remained range-bound for over two months, between $91,500 and $106,500, signaling ongoing consolidation.
While Bitcoin hit a year-to-date high of $109,000 on January 19, it has since retraced, struggling to sustain momentum above its recent peak
Technical symmetry indicates a potential BTC rally
According to the analysis, Bitcoin recently broke above a key Lower Highs trendline after rebounding from its February 3 low
We współpracy z: https://finbold.com/this-chart-pattern-sets-bitcoins-next-short-term-price-targets/


