Amid arguably the coldest winter in Bitcoin’s history, its price has fallen by more than 70% from its Nov. 10, 2021, all-time high of $69,044.77, while its market cap is down to $318.943 billion from the yearly high of $902.04 billion — a 64.64% decline.
Let’s take a look at some metrics that can provide more insight into the current Bitcoin bear market:
Transfer Volume Momentum
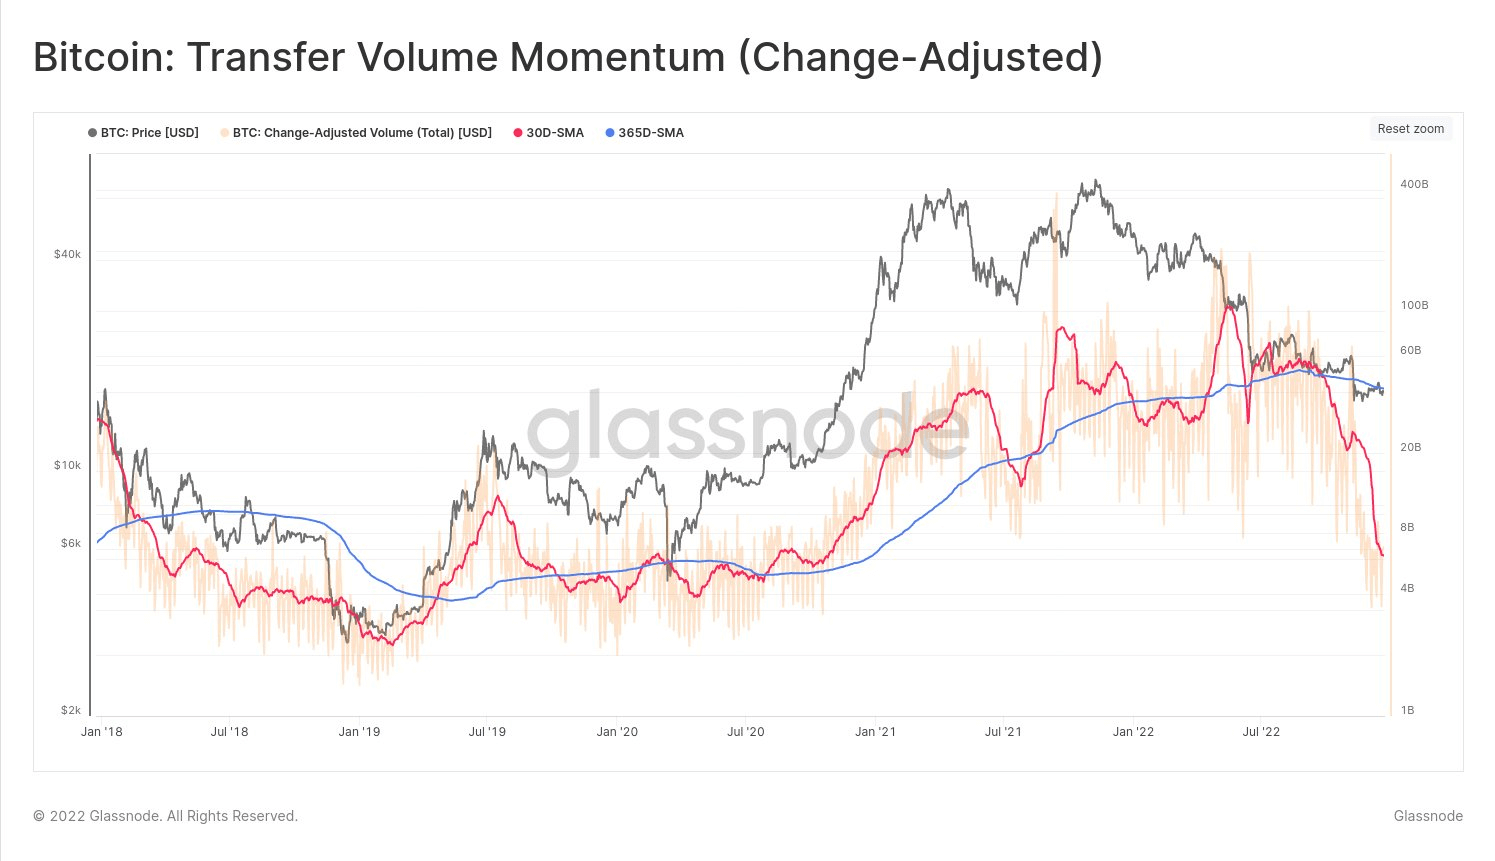
Before June, the 30-day Moving average (DMA) (red line) transfer volume in BTC reached new highs, but after the Luna-Terra crash, it rapidly declined and now stands at new lows.
Change in Bitcoin transfer volume since January 2018 (Source: Glassnode)
Transfer volume on the Bitcoin network provides an indication of the current level of network activity and the value that is being transferred in BTC and USD. This metric compares the monthly average (red line) transfer volume against the yearly average (blue line) to underline relative shifts in dominant sentiment and help identify when the tides are turn
We współpracy z: https://cryptoslate.com/research-the-bearish-case-for-bitcoin-as-2022-ends/