Onchain Highlights
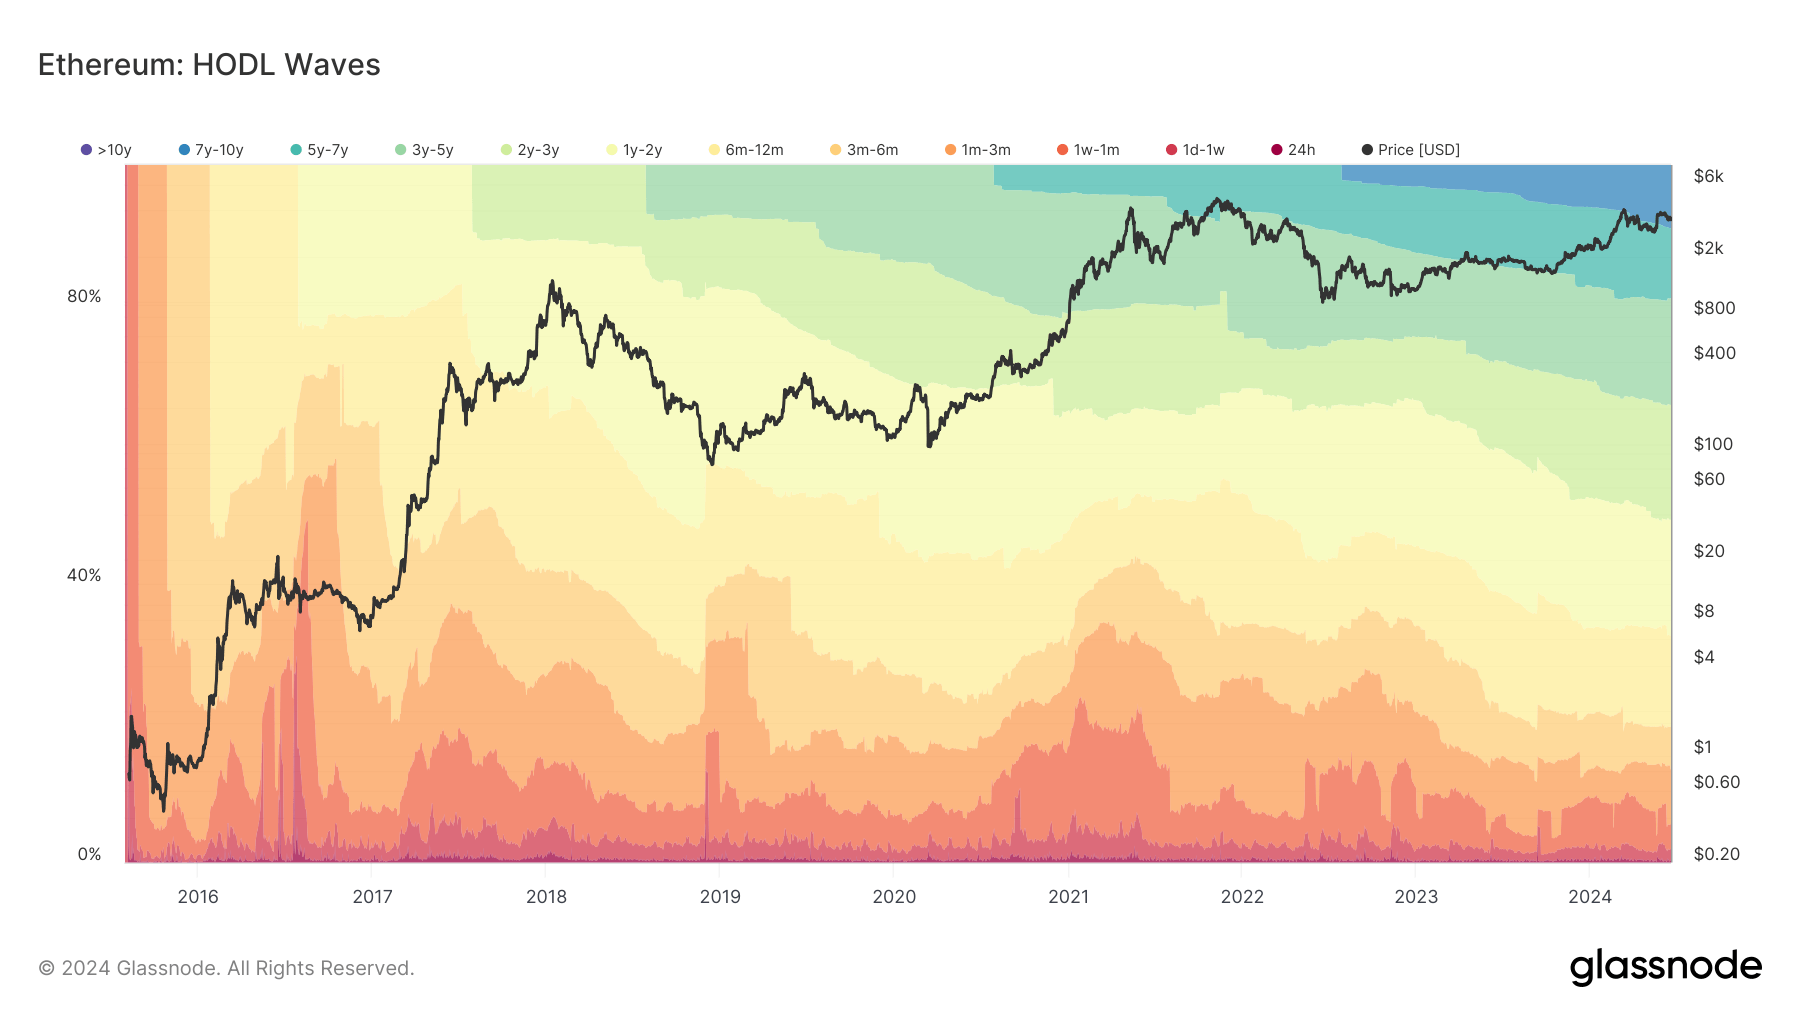
DEFINITION: Bundle of all active supply age bands, aka HODL waves. Each colored band shows the percentage of Ethereum in existence that was last moved within the time period denoted in the legend.
Ethereum’s HODL Waves chart illustrates the distribution of held Ethereum over various time periods, indicating shifting trends in holding behavior among investors. The chart shows a noticeable concentration of Ethereum held for one to three years, signaling a significant amount of Ethereum acquired during the 2021-2022 period is still being held. The 1-2 year and 2-3 year bands reflect these holdings, comprising a substantial portion of the overall supply.
Ethereum: HODL Waves: (Source: Glassnode)
This holding pattern suggests confidence in Ethereum’s long-term value, with a significant portion of investors opting to retain their holdings rather than sell in response to market fluctuations. The decline in the proportion of Ethereum held for less than six months further
We współpracy z: https://cryptoslate.com/insights/long-term-ethereum-holders-reach-new-high/