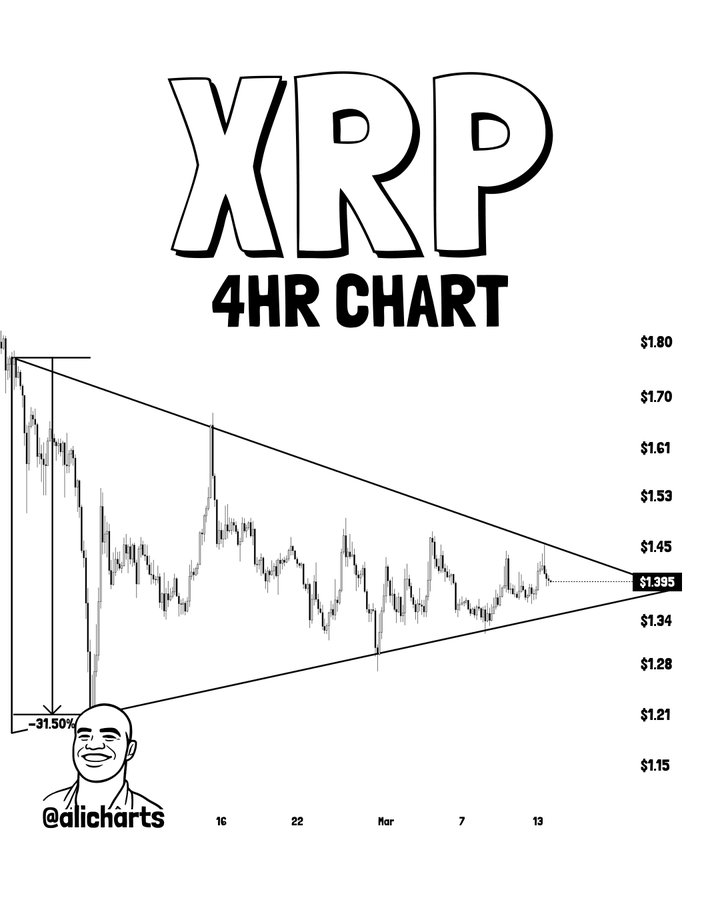
After days of consolidation around the $1.40 level, XRP may be approaching a decisive moment as technical indicators point to a potential breakout.
In this regard, insights by cryptocurrency trading expert Ali Martinez in an X post on March 14 noted that the digital asset has been consolidating inside a symmetrical triangle pattern.
This formation typically precedes a strong directional move once price escapes the narrowing range.
The triangle’s upper boundary slopes down from about $1.70, forming lower highs, while the lower boundary rises from roughly $1.28, creating higher lows. This tightening range reflects declining volatility as buyers and sellers reach equilibrium, often signaling an impending breakout.
XRP price analysis chart. Source: Ali_charts
Notably, the pattern formed after XRP dropped more than 30%, with the asset then moving sideways while repeatedly testing both support and resistance. Each rejection has further compressed the range, bringing the pri
We współpracy z: https://finbold.com/heres-why-xrp-is-set-for-a-major-30-move/