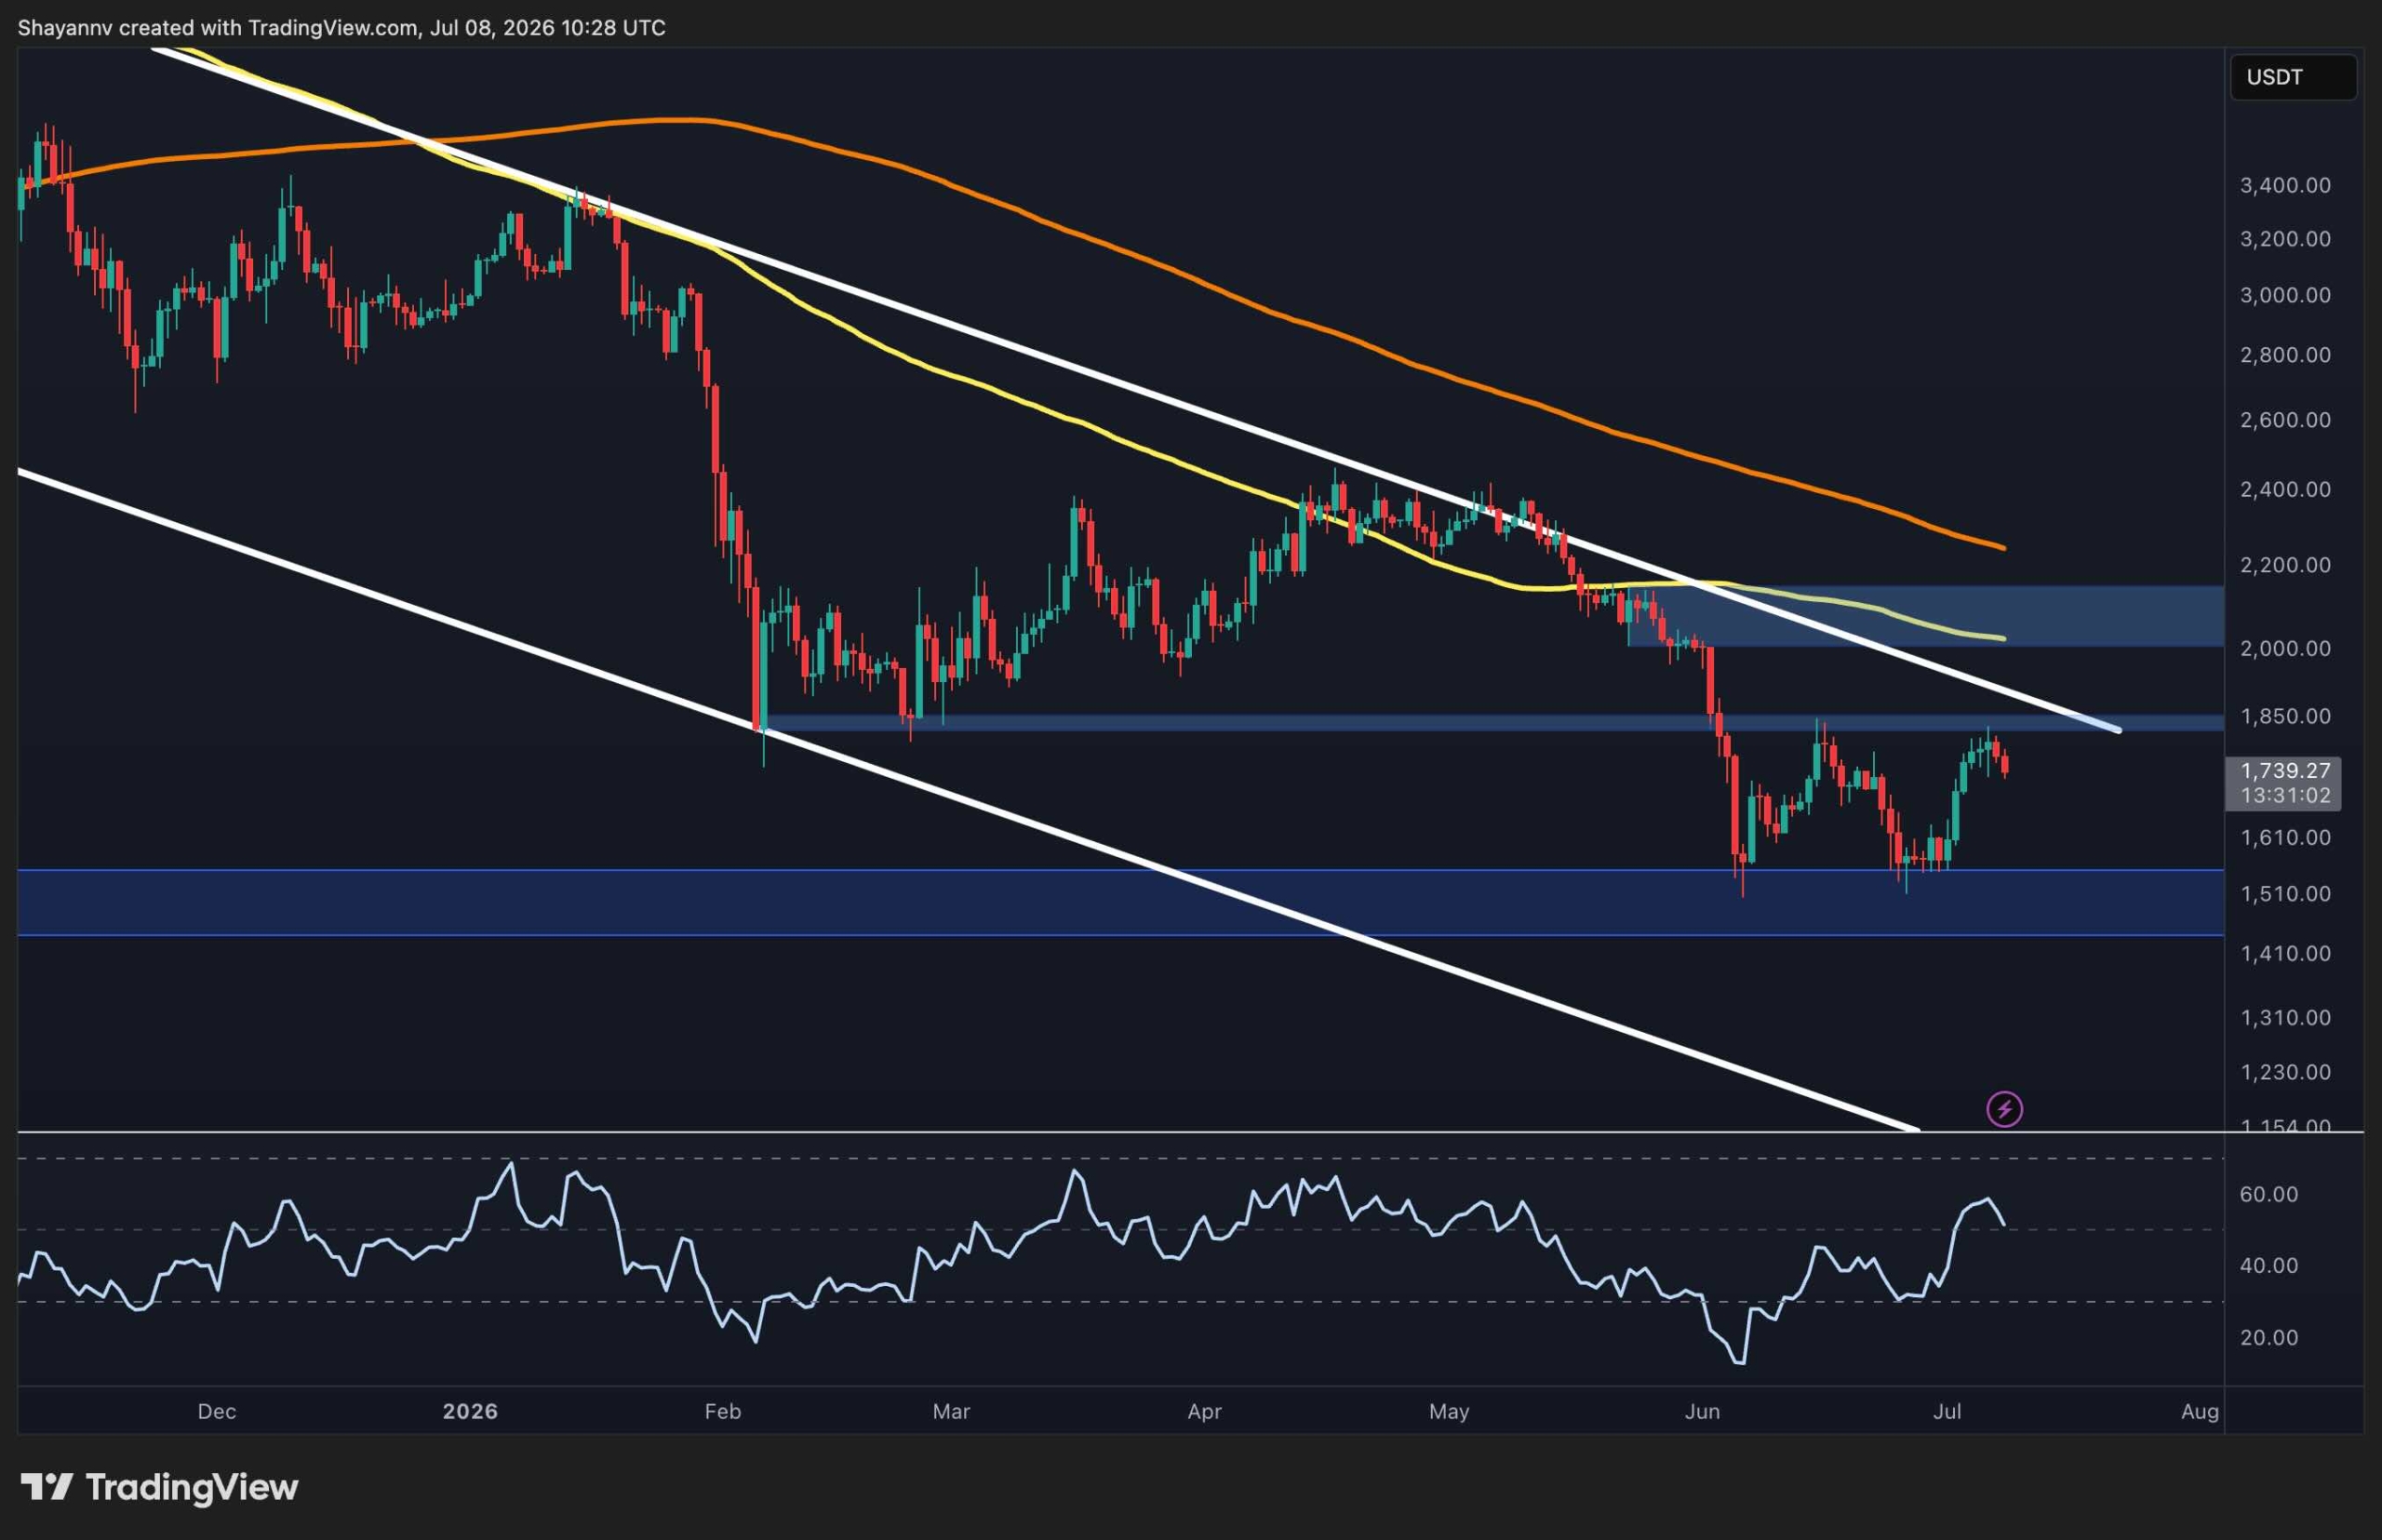
Ethereum has been trying to recover from its early June sell-off, but the rebound is getting rejected from a technically significant resistance area. While short-term momentum still remains constructive, both the daily structure and the Coinbase Premium Index suggest buyers still have work to do before confirming a broader trend reversal.
Ethereum Price Analysis: The Daily Chart
The daily chart shows ETH trading around $1.74K after bouncing from the major demand zone at $1.5K. That area once again attracted buyers and produced a sharp recovery, allowing the asset to attack the $1.85K region once more.
Despite the rebound, Ethereum remains below the long-term descending trendline that has capped it since last year. The recovery has also stalled beneath the resistance at $1.85K, which almost aligns with the trendline and represents the first major barrier buyers must overcome.
Adding to the bearish higher-timeframe picture, the price continues to trade below both the 100-day and 200-day
We współpracy z: https://cryptopotato.com/ethereum-price-analysis-fresh-pullback-pushes-eth-further-from-2k/