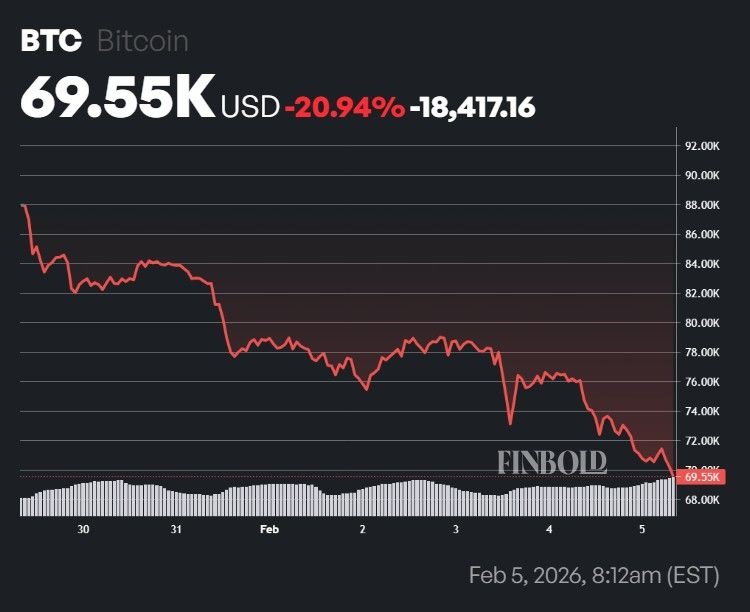
The famous ‘Big Short’ investor Michael Burry made an X post late on February 4 in which he not only flagged critical Bitcoin (BTC) price levels but also seemingly correctly anticipated the flash crash toward $69,000 that took place in the morning of February 5.
Specifically, the famous ‘Big Short’ investor made a post late on Wednesday, simply captioned ‘$BTC Patterns,’ in which he shared a multi-year chart for the cryptocurrency with two points marked by red arrows.
The first points to the downward slope between a local top on April 2, 2022, and a temporary stabilization in mid-May and early June. The other arrow simply points at the ongoing downturn in early February 2026.
$BTC Patterns pic.twitter.com/Ax595mNXrD
— Cassandra Unchained (@michaeljburry) February 4, 2026
Is Michael Burry signaling a repeat of Bitcoin’s 2022 cycle?
Admittedly, and in the finest tradition of ancient oracles – Burry is known as Cassandra Unchained on X, referencing Ki
We współpracy z: https://finbold.com/big-short-michael-burry-flags-key-levels-on-the-bitcoin-chart/