Ethereum has displayed bearish signals after breaking below its 100-day moving average, underscoring increased selling activity.
However, the 200-day MA, acting as the buyers’ last defense, still holds, offering hope for a potential rebound.
Technical Analysis
By Shayan
The Daily Chart
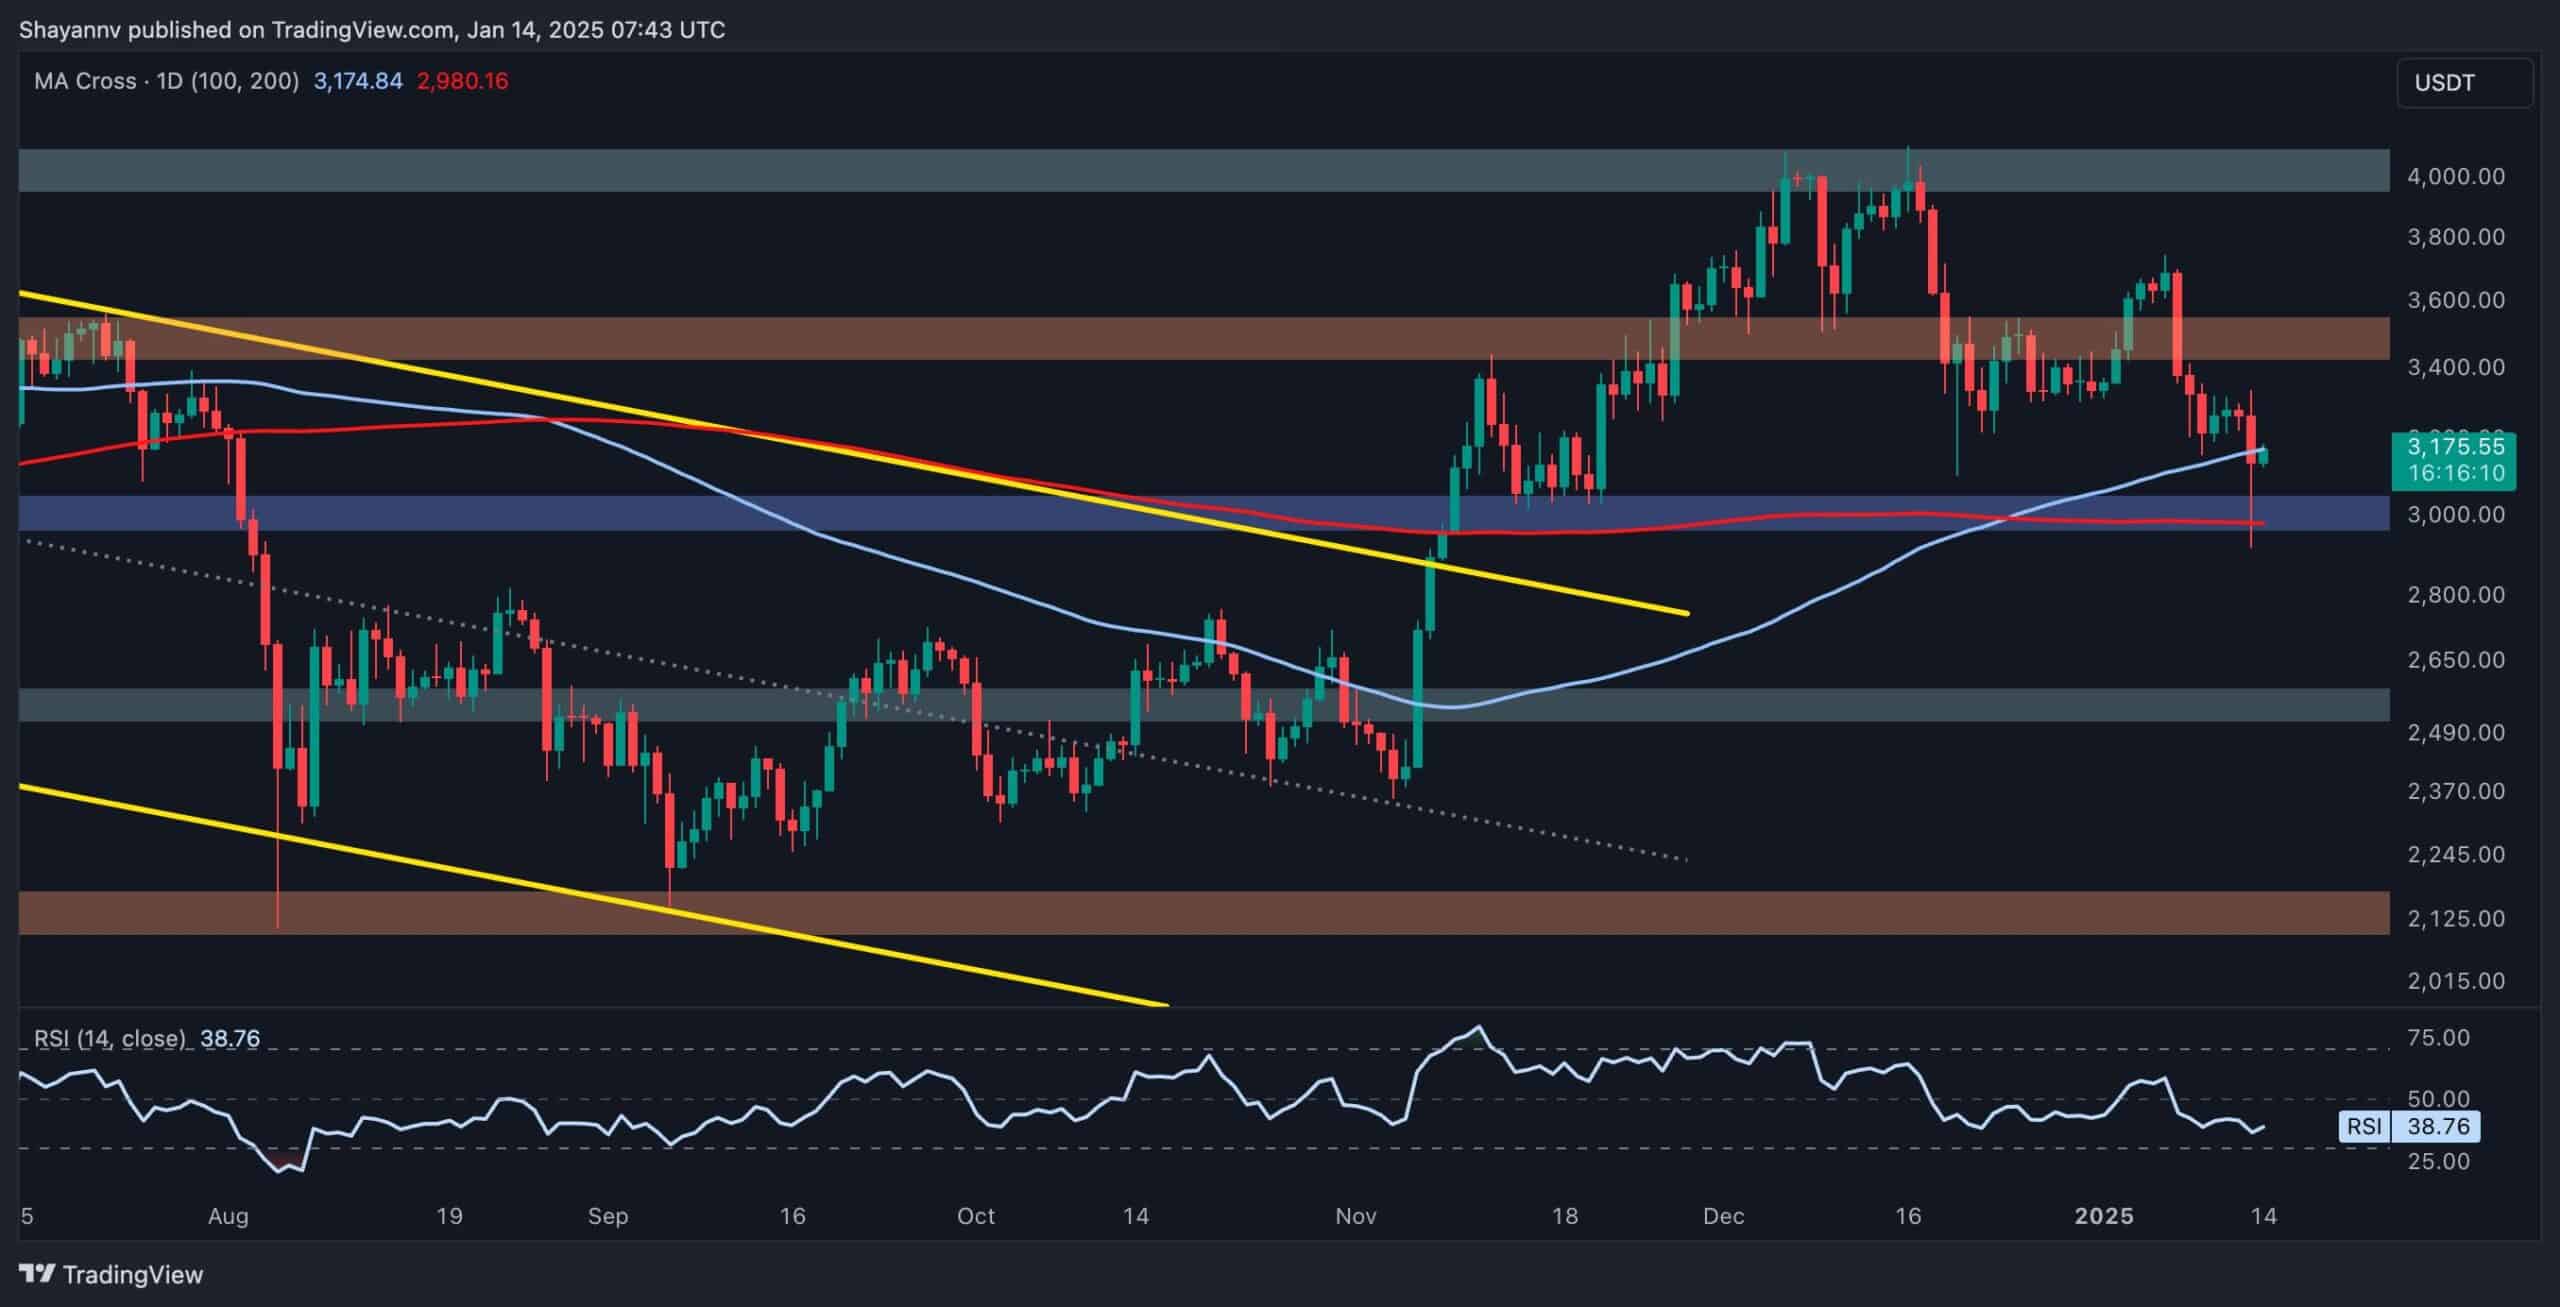
ETH recently broke below the significant 100-day MA at $3.1K, signaling the sellers’ growing dominance. This breakdown points to a potential test of the $3K support region, a critical juncture aligned with the 200-day MA.
Currently, Ethereum is finding temporary support at this level, with a modest bullish reversal hinting at demand from buyers. The 200-day MA serves as the primary defensive line for bulls, and its ability to hold will determine the short-term trajectory. A breakdown below this level could trigger a mid-term bearish trend, targeting the $2.5K support zone.
The 4-Hour Chart
On the 4-hour timeframe, ETH saw consolidation near the 0.5 Fibonacci retracement level ($3.2K) before sellers o
We współpracy z: https://cryptopotato.com/ethereum-price-analysis-eth-risks-falling-to-2-5k-if-this-support-breaks/