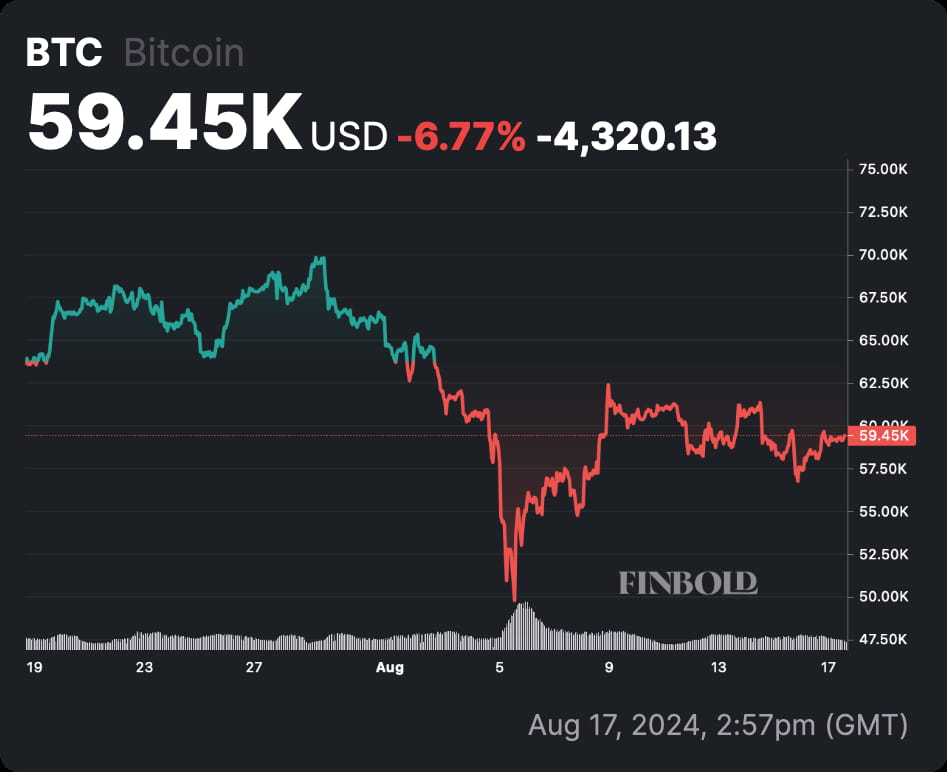
Bitcoin (BTC) started the weekend with a slightly more positive sentiment after a mostly bearish week, seeing some price recovery. However, a technical analyst warns of more downside potential for the leading cryptocurrency, looking at the one-hour chart.
Ben Walther, a high-reputation analyst on TradingView, shared two recent Bitcoin price analyses that examined key levels and chart patterns. In both analyses, Walther concluded that BTC could still see significantly lower prices against the dollar, eyeing sub-$54,000.
As of this writing, Bitcoin trades at $59,450, recovering from the price crash to $50,000 in early August. Despite the crash-to-date recovery, BTC still trades with 6.77% losses in the last 30 days, below the $60,000 key psychological level.
Bitcoin (BTC) 30-day price chart. Source: Finbold
Bitcoin’s key support level was briefly broken
On August 15, Walther shared the first analysis of Bitcoin and Ethereum (ETH), tracing key support levels for both crypto
We współpracy z: https://finbold.com/analyst-warns-bitcoin-chart-indicates-more-down-for-august/